

By Lauren Borg, University of Wollongong
An article focusing on the topic of wheat might seem a little dull, even for a mathematical sciences blog, but wheat is really an unsung hero and it’s time it had a platform to emphasise just how imperative a simple plant species can be. Wheat is one of the major crops grown in Australia and is a multi-billion dollar commodity of great importance to our agricultural industry. Most of Australian wheat is sold overseas contributing significantly to Australia’s economy. Wheat is grown for domestic consumption and feedstock, making it a staple food of almost half the world’s population with 5 million tonnes of wheat consumed annually in Australia alone. However, the Australian wheat industry is facing challenges around sustainability due to a rising population as well as climate change, which limits the amount of land viable for crop growth. It might sound dramatic but the fate of the world truly depends on overcoming these challenges and so there is currently much research into plant breeding to source varieties of wheat that produce optimum yields. As you can now see, wheat is not so dull after all; so much so that companies in Australia are willing to pour upwards of 80 million dollars into such research.
Research is conducted by growing thousands of varieties of wheat in several locations across Australia and selecting the highest yielding varieties to continue to the next stage of selection. At each subsequent stage there are fewer varieties but more replications and experiment locations. The data collected needs to be analysed to determine which varieties will be selected onto the next stage. This is achieved by fitting the data to a statistical model which allows us to make estimations on how the varieties performed in the experiment but more importantly, it allows us to predict how varieties will perform in the future if they were to be selected and taken up by the commercial agriculture industry. The trick is finding the right model that will fully explain the data! This was the focus of my report; fitting a model to the data, analysing how well it fits and then tweaking this model until it better suits what was observed.
I used spatial analysis in order to form the model for the data; this takes into account variation that results from the location of a plot (containing a wheat variety) in the field. This variation may result from the direction the machine is travelling when distributing the seed or changes in fertility of the soil across the field or the gradient of the land resulting in water collecting in some areas. The list goes on and all, or more realistically, most of this variation needs to be taken into account in order to fit an appropriate model to the data and produce the most accurate estimate of the effect of each variety on crop yield.
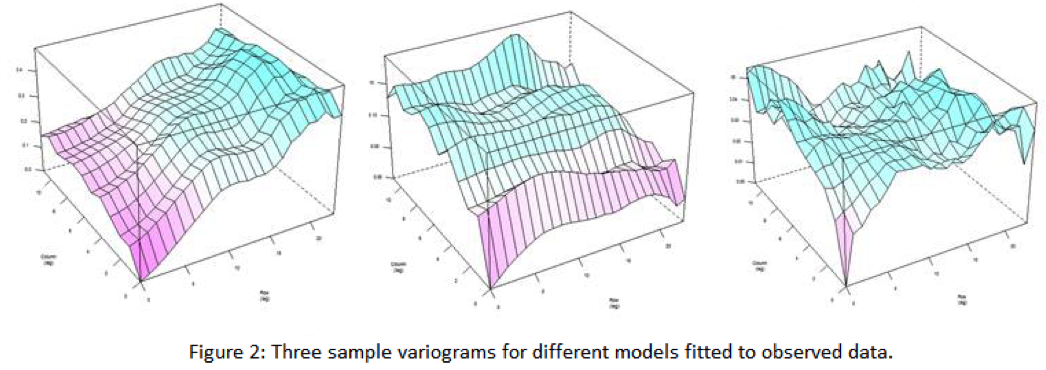
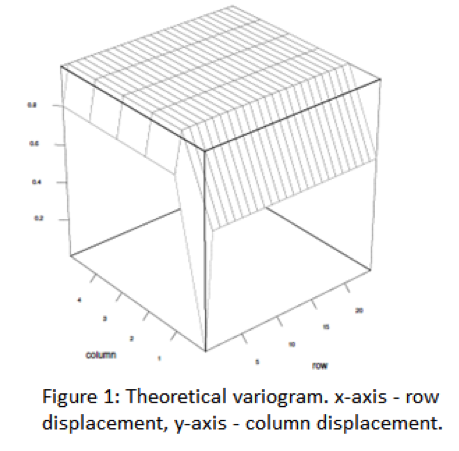 Variograms are diagnostic tools used in spatial analysis to determine how well a model explains the data. They are graphical representations of spatial dependence, where the x-axis shows the number of rows between 2 plots, the y-axis shows the number of columns between the 2 plots and the z-axis shows the difference for the two plots in error as a result of fitting the model. A theoretical variogram uses data that is simulated from the assumed model and a sample variogram uses the actual observed data. Ideally these two graphs should be the same if the correct model has been fitted. Comparing the two graphs can allow for identification of trends that correlate with certain sources of variation which can then be included in the model to produce a better fit to the data. Figure 1 shows an example of a theoretical variogram which can then be compared to Figure 2, showing several sample variograms. As you can see the left model in Figure 2 most closely resembles the theoretical model and so it would be used to analyse the data to determine the highest yielding varieties of wheat.
This is a crucial area of research for the sustainability of a resource that not only makes substantial contributions to the Australian economy but provides the world with a valuable food source.
Lauren Borg was one of the recipients of a 2014/15 AMSI Vacation Research Scholarship.